


Next: Analysing the real 3D
Up: Computing Wakepotentials
Previous: Looking at Wakepotentials
Contents
Since we specified
    -time
        firstsaved= 0.1/@clight
        lastsaved= 1/@clight
        distancesaved= 0.1/@clight
in the inputfile for gd1, gd1 did save the electric and magnetic fields
at several times.
We look at the 30.th saved electric field:
 -3darrow
     symbol= e_4
     arrows= 40000 # default is 1000
                   # but for wakefields, better take more
     doit
The resulting plot is shown in figure 4.3
Figure 4.3:
The electric field as induced by a line charge traveling on the axis.
The direction of the arrows indicate the direction of the field, and their size
is proportional to the absolute value of the field strength.
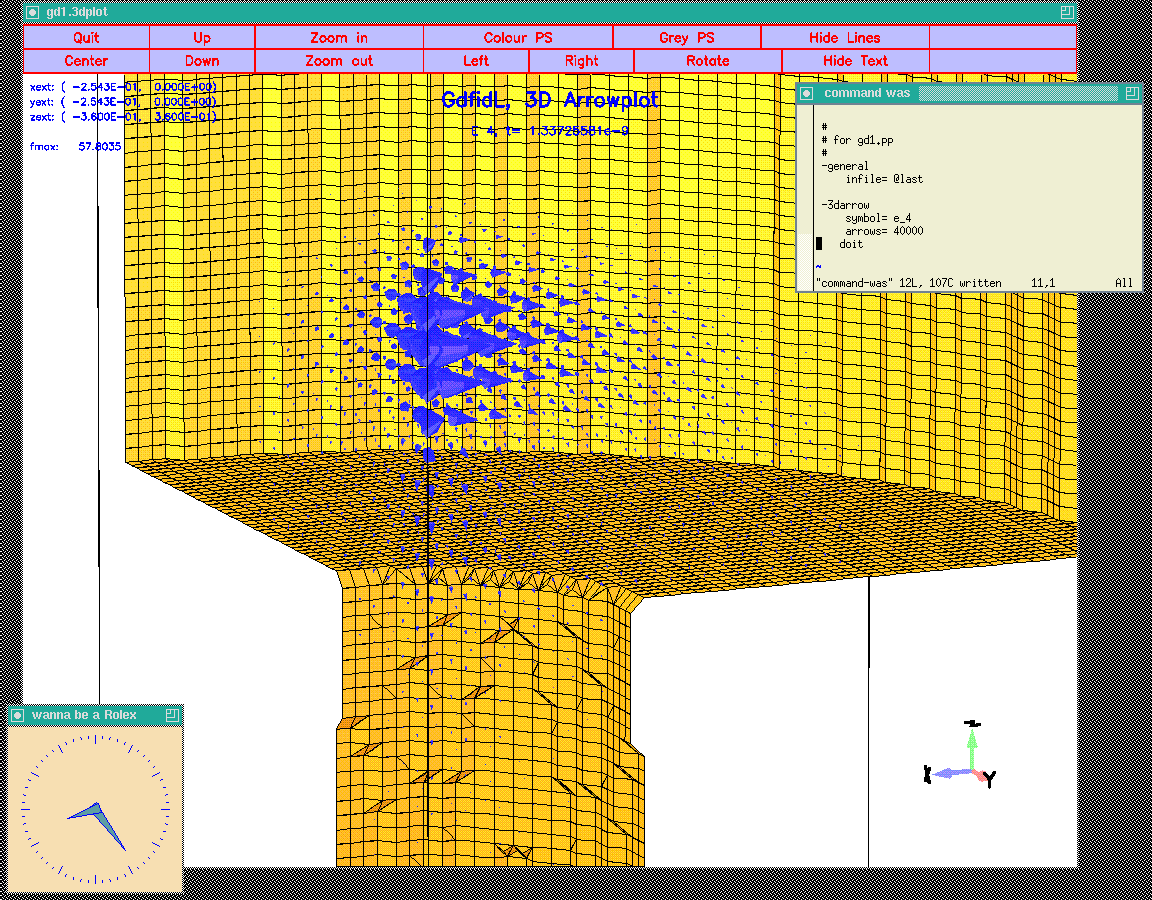 |
Since the field near the line charge is extremely large
(it is singular in reality), we see mostly field near the charge.
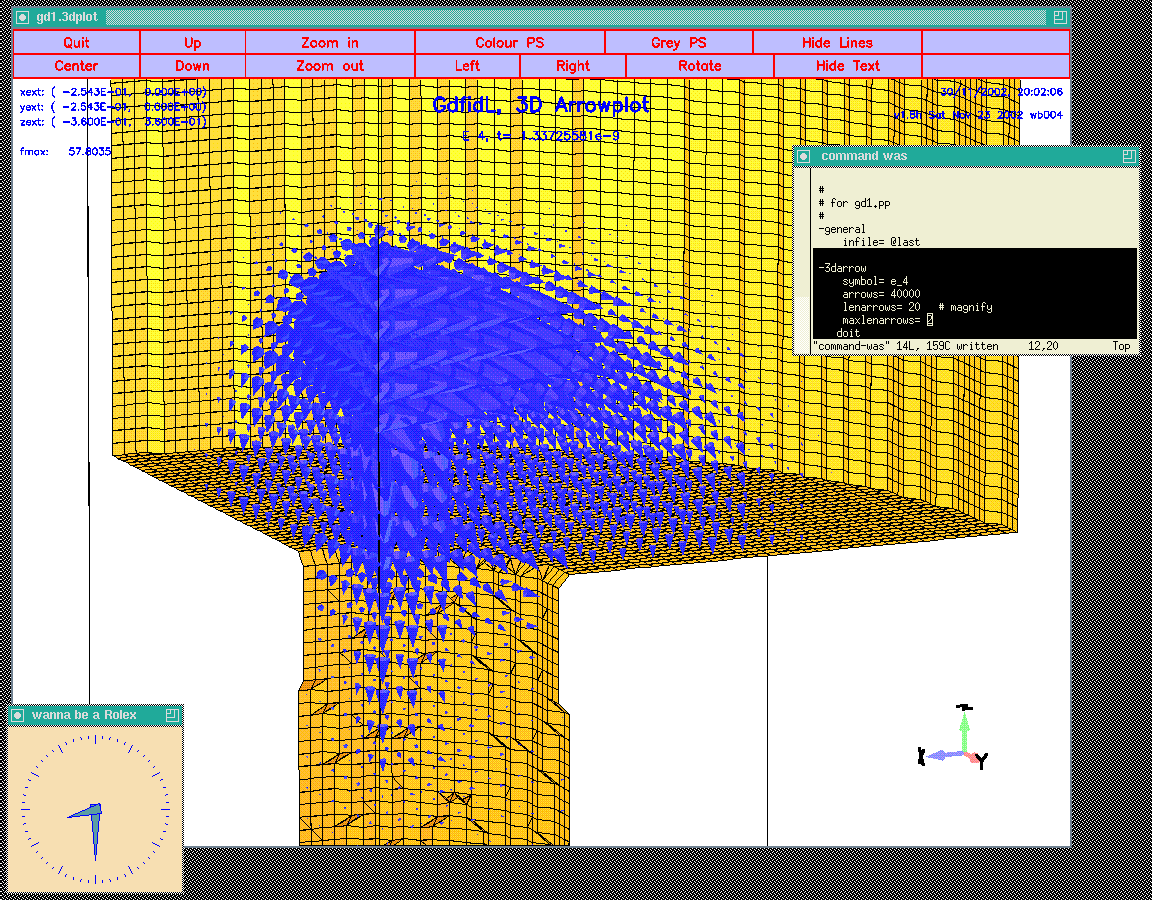
In order to see the field away from the line charge, we specify that we want
to magnify the arrows by a factor of 20, but we do not want to have any arrow
larger than "2":
 -3darrow
     symbol= e_4
     arrows= 40000    # default is 1000
                      # but for wakefields, better take more
     lenarrows= 20    # <- magnify
     maxlenarrows= 2  # .. but no arrow larger than "2"
     doit
The resulting plot is shown in figure 4.4
Figure 4.4:
The electric field as induced by a line charge traveling on the axis.
The direction of the arrows indicate the direction of the field.
Their size now is not proportional to the field strength, since we
did specify that there should be a treshold value of "maxlenarrows= 2".
 |
Next: Analysing the real 3D
Up: Computing Wakepotentials
Previous: Looking at Wakepotentials
Contents