The computation of scattering parameters occurs in two steps.
# /usr/local/gd1/examples-from-the-manual/spar-example-1.gdf
define(LargeNumber, 1000)
define( a, 1e-2 )
define( b, 5e-3 )
define( c, 5e-3 )
define( d, 1e-2 )
define(FREQ, 20e9)
-general
outfile= /tmp/UserName/spar-example
scratch= /tmp/UserName/spar-example-scratch
text()= A strange geometry, just an example
-mesh
define(STPSZE, 3*a/60 )
spacing= STPSZE
graded= yes, qfgraded= 1.2, dmaxgraded= @clight / FREQ / 20
perfectmesh= no
pxlow= 0, pxhigh= c+b
pylow= -STPSZE, pyhigh= d
pzlow= 0, pzhigh= 3*a
cxlow= ele, cxhigh= ele
cylow= ele, cyhigh= ele
czlow= ele, czhigh= ele
-brick
#
# fill the universe with metal
#
material= 1
volume= (-LargeNumber, LargeNumber,\
-LargeNumber, LargeNumber,\
-LargeNumber, LargeNumber)
doit
#
# carve out the waveguide
#
mat 0
xlow= 0, xhigh= c
ylow= 0, yhigh= LargeNumber
zlow= -LargeNumber, zhigh= LargeNumber
doit
#
# Carve out resonator box
#
mat 0
xlow= 0, xhigh= c+b
ylow= 0, yhigh= LargeNumber
zlow= a, zhigh= 2*a
doit
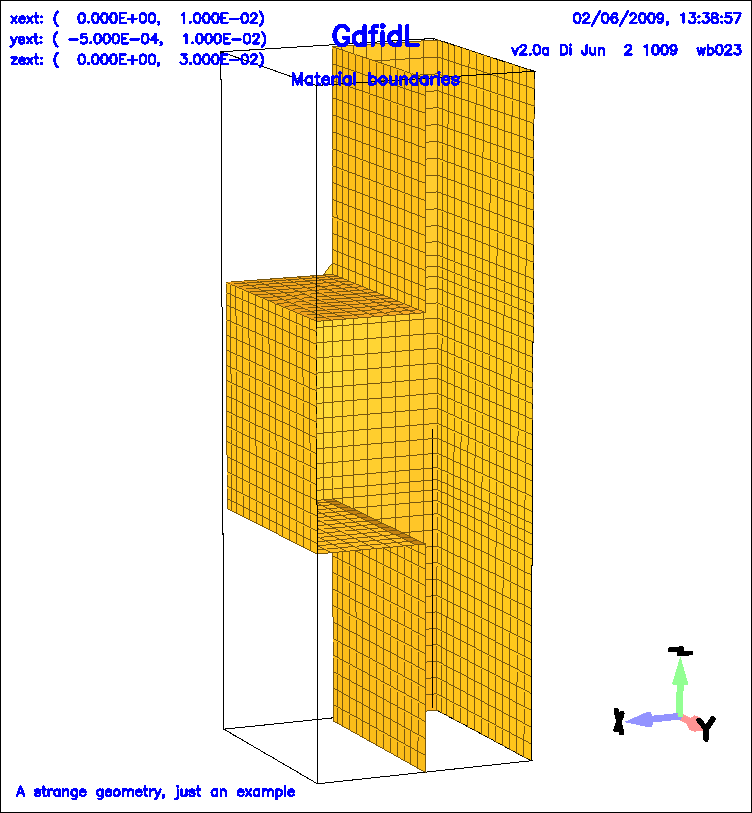
-volumeplot
eyepos= ( 1.0, 2.30, 0.5 )
showlines= yes
scale= 3
doit
-fdtd
-ports
name= Input, plane= zlow, modes= 1, doit
name= Output, plane= zhigh, modes= 1, doit
-pexcitation
port= Input
mode= 1
amplitude= 1
frequency= FREQ
bandwidth= 0.7*FREQ
-time
#
# tminimum: the minumum time to be simulated
# tmaximum: the maximum time to be simulated
# If the amplitudes have died down sufficiently
# at a time between tmin and tmax,
# the computation will stop.
#
tmin= 10/FREQ
tmax= 1000/FREQ
amptresh= 1e-3
-fdtd
doit
We start gd1 with the command:
gd1 < spar-example-1.gdf | tee out
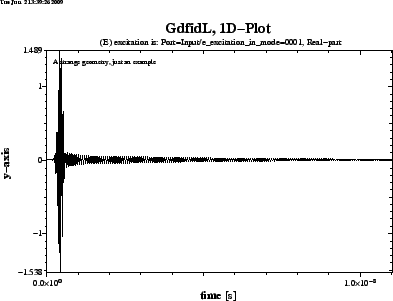
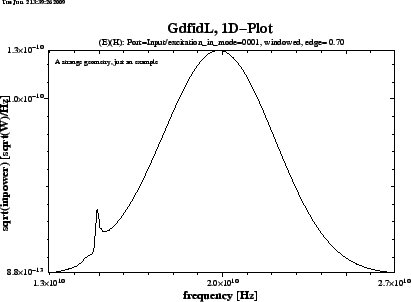
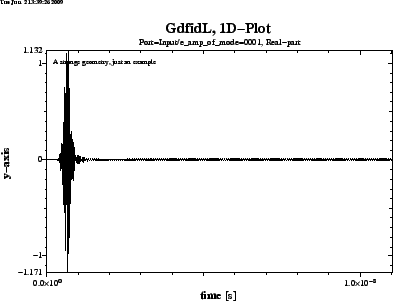
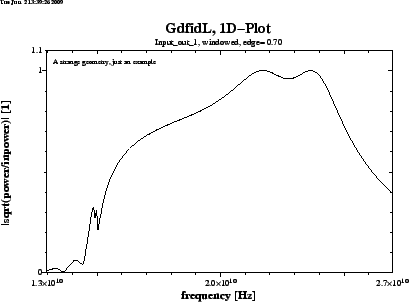
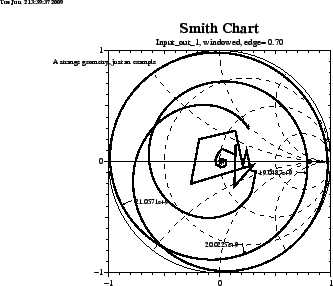
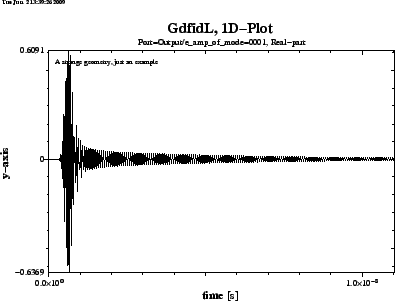
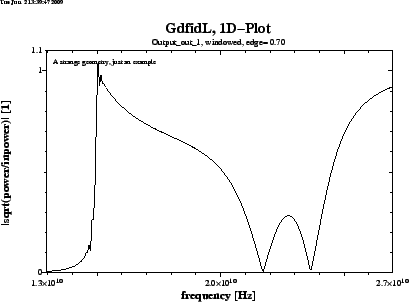
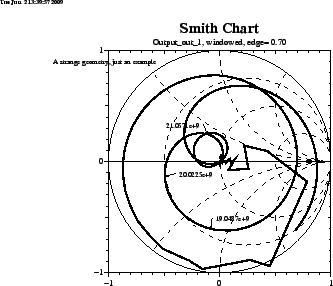
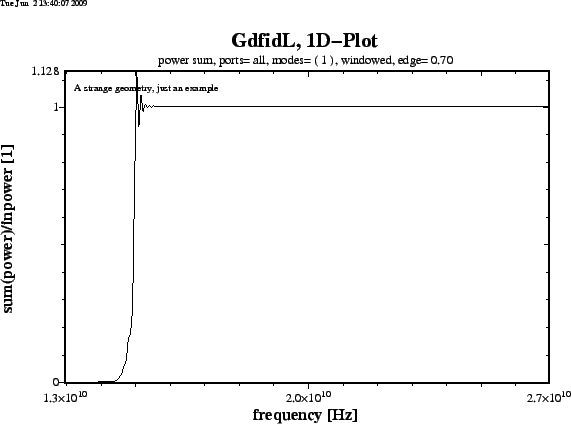
The next step is to tell the postprocessor that we wish the scattering parameters to be computed and plotted. In addition to the default values, we want to see the timedata that were recorded during the time-domain computation, and we want to see the scattering parameters in a smith-chart. The commands for the postprocessor gd1.pp are:
 -general, infile= @last
 -sparameter
    ports= all, modes= 1
    timedata= yes
    smithplot= yes, markerat 19e9, markerat 20e9, markerat 21e9
    doit
We get in total 9 plots.
 |
 |
 |
 |